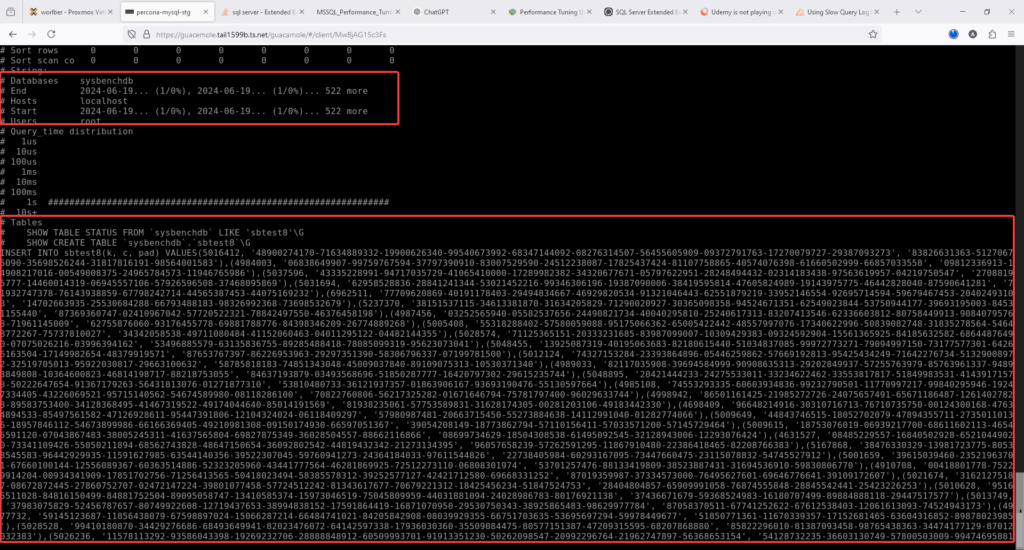
Getting MySQL Report from pt-mysql-summary
This tool will generate report what is configuration for MySQL instance , how many replica MySQL has
Or if the MySQL itself is replica , how many uses are connected
What are the users doing
How many databases
How bug us innodb buffer pool size
What is the version of OS and so on
to run te command use the below syntax
pt-mysql-summary  --user=[username] --ask-pass

pt-mysql-summary  --user=root --ask-pass
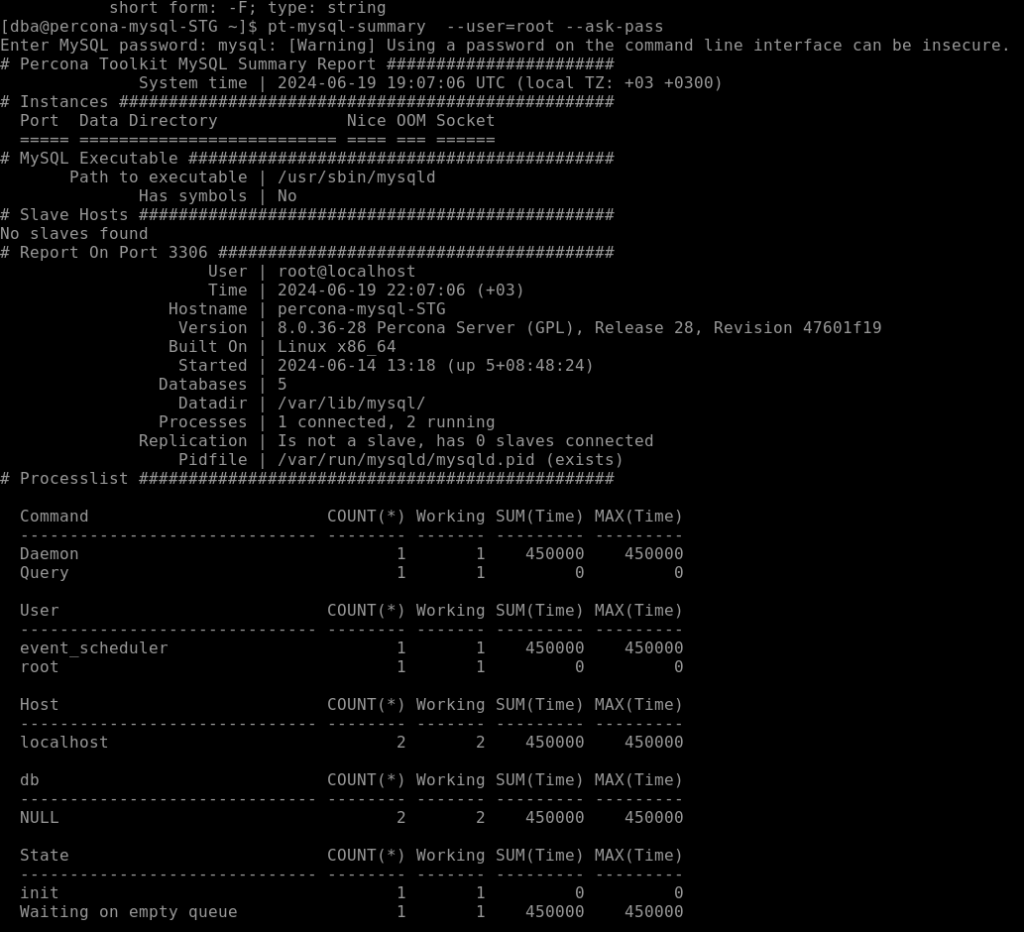
first output will show if this master slave and if it slave and what is the slave server-id
also will show hostname
- mysql port
- datadir
- replication status
- how many databases there
- how many prosses connected

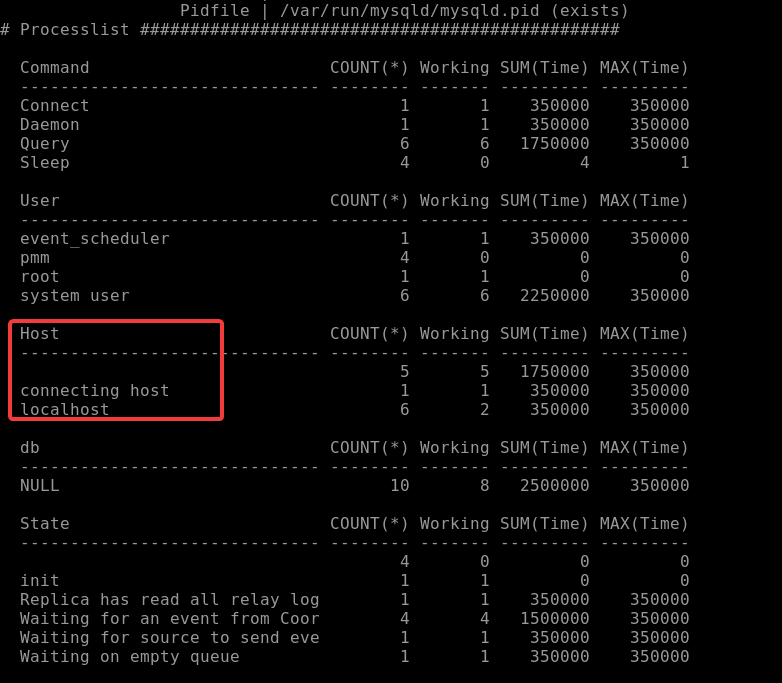
if go down you will find list of prosseslist and what they are doing
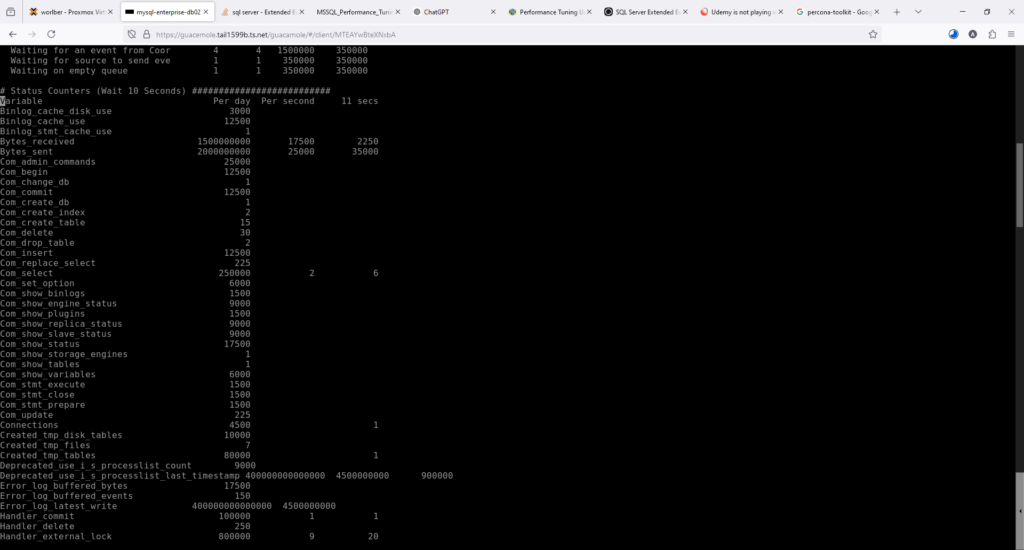
scroll down you will find mysql variable that are runinng
scroll down you will find key percona server features that are enabled
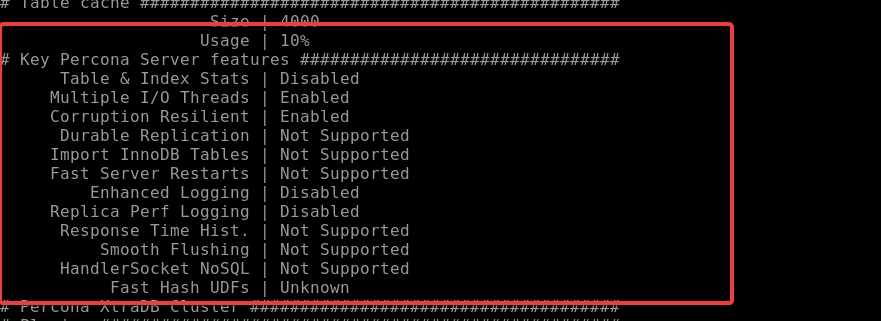
scroll down you will find information about innodb that include
- innodb pool size
- innodb pool usage
- percentage of dirty pages
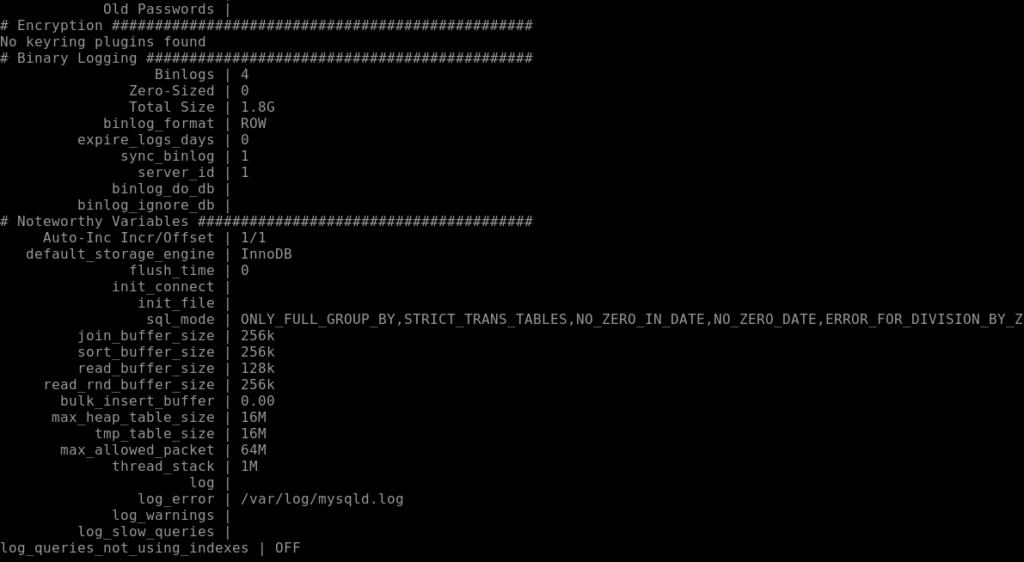
scroll down you will find information about binary log
configuration file and its path

pt-summary
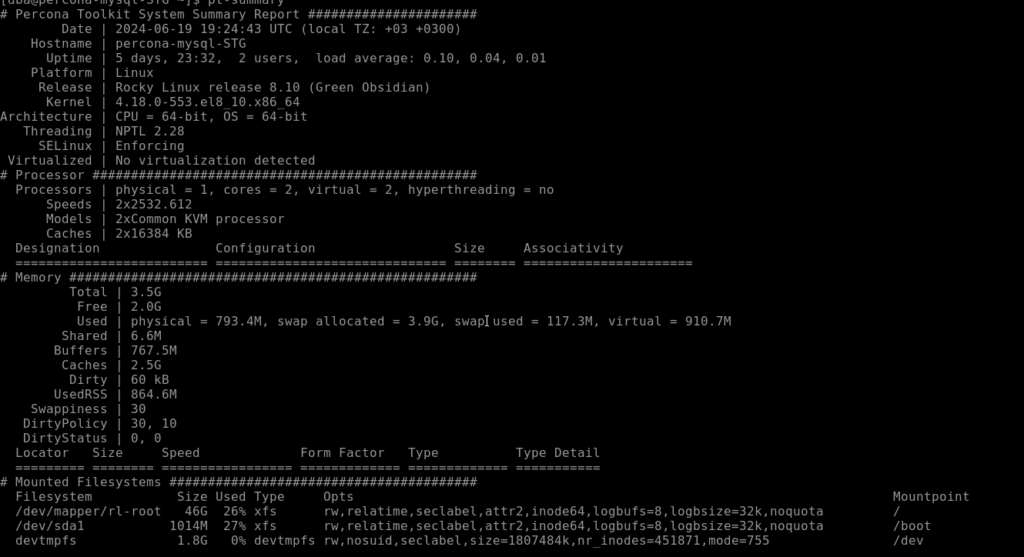
Pt-summary give system report mainly about the system articture itself
That include
- Version of os
- How many cpu
- How mush memory the system has
- What are the disk what are the filesystem
- where each filesystem is mounted
- networking information
syntax
pt-summary
MySQL Slow Query Log
What if you runinng issue that querys are runinng slow on your database
Some queries taking maybe five seconds then seconds
There is way to find this slow running query in MySQL
MySQL Slow Query Log log any query that MySQL consider to be slow
- slow query log consist of all sql statement that take more that variable value
long_query_timeto execute - MySQL engine has define variable called
long_query_timeby default it measure in seconds - any query exceed the threshold in variable
long_query_timewill be logged and considered as slow query mysqldumpslowis tool installed by default that process slow query log , if you run the utility and location of slow query log it read all slow query log and give you nice summarypt-query-digestalso tool that work similar tomysqldumpslow
Enable MySQL Slow Query Log
- The variable
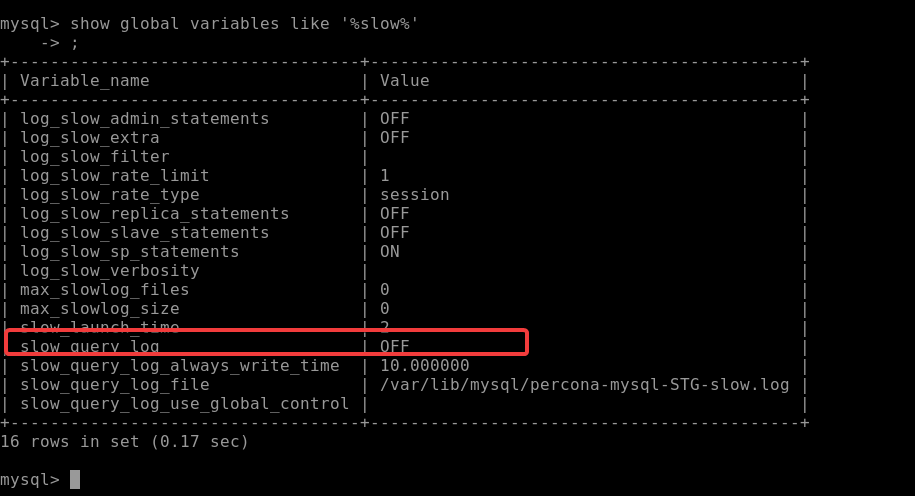
slow-query-logis disabled by default - the default value variable
long_query_time= is 10 second slow-query-log-fileis variable that you defined where to store slow query log- The variable
log-queries-not-using-indexesthat will log query that are not using index (optional) - To check if slow query log is enable
show global variables like '%slow%';
Note: SElinux must be disabled
Setup File for Slow Query Log
mkdir -p /var/log/mysql/slow-logs
touch /var/log/mysql/slow-logs/slow-logs.log
chown -R mysql:mysql /var/log/mysql/

Enable Slow Query Log
Open my.Cnf file and add the variablesslow-query-log
And slow-query-log-file=path
vi /etc/my.cnf
slow-query-log=true
log-queries-not-using-indexes
log-slow-admin-statements
log-slow-extra
log-slow-replica-statements (Only Replica)
slow-query-log-file = /var/log/mysql/slow-logs/slow-logs.log
long-query-time = 1

Validate config for any syntax error
mysqld --validate-config

restart MySQLsystemctl restart mysqld

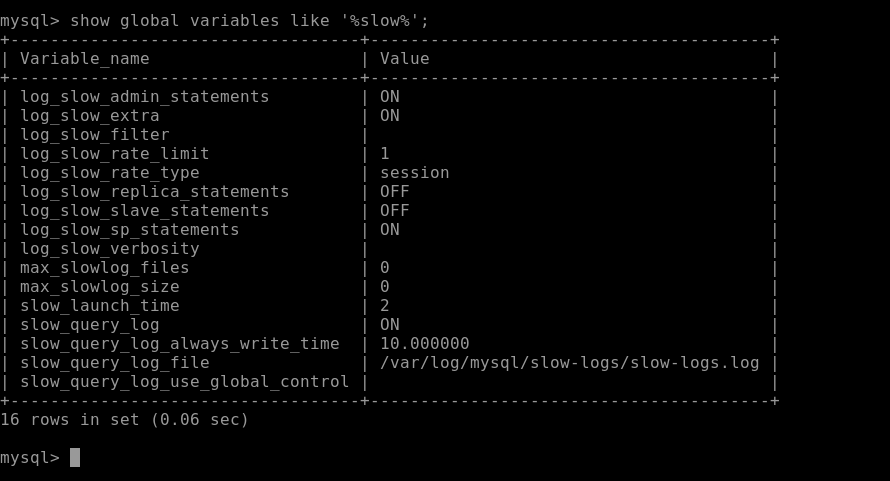
confirm query log is on
show global variables like '%slow%';
Using Mysqlumpslow and Percona-Digist to Read Slow Query
mysqldumpslow utility
to view slow query we will use mysqldumpslow
syntax
mysqldumpslow [slow query path]

mysqldumpslow /var/log/mysql/slow-logs/slow-logs.log
Note: Only work oracle or community MySQL
Doesn’t support percona mysql

pt-query-digest
Similar to mysqldumpslow will give summary reading from slow query log
pt-query-digest /var/log/mysql/slow-logs/slow-logs.log
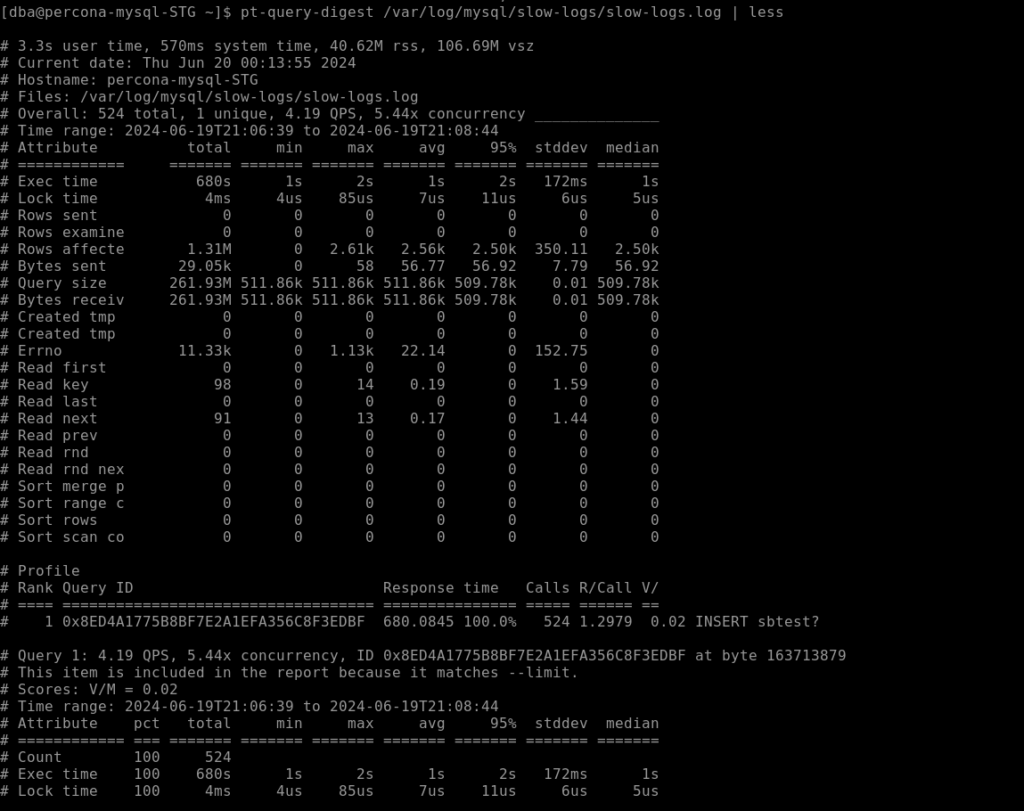
The first in top will show overall status of the query with following
- Rows examined
- Query size
- Total number of query examined
- Lock time
Also the overview will show rank tabele of the query m how mush total time it took toexecute , what type of dml done on query and on which database
Scroll down it will display query with higtiest time to execute to be on top ascending to lowest
First you want to see is query time distribution
It start from most expensive that if this query ten seconds plus this display
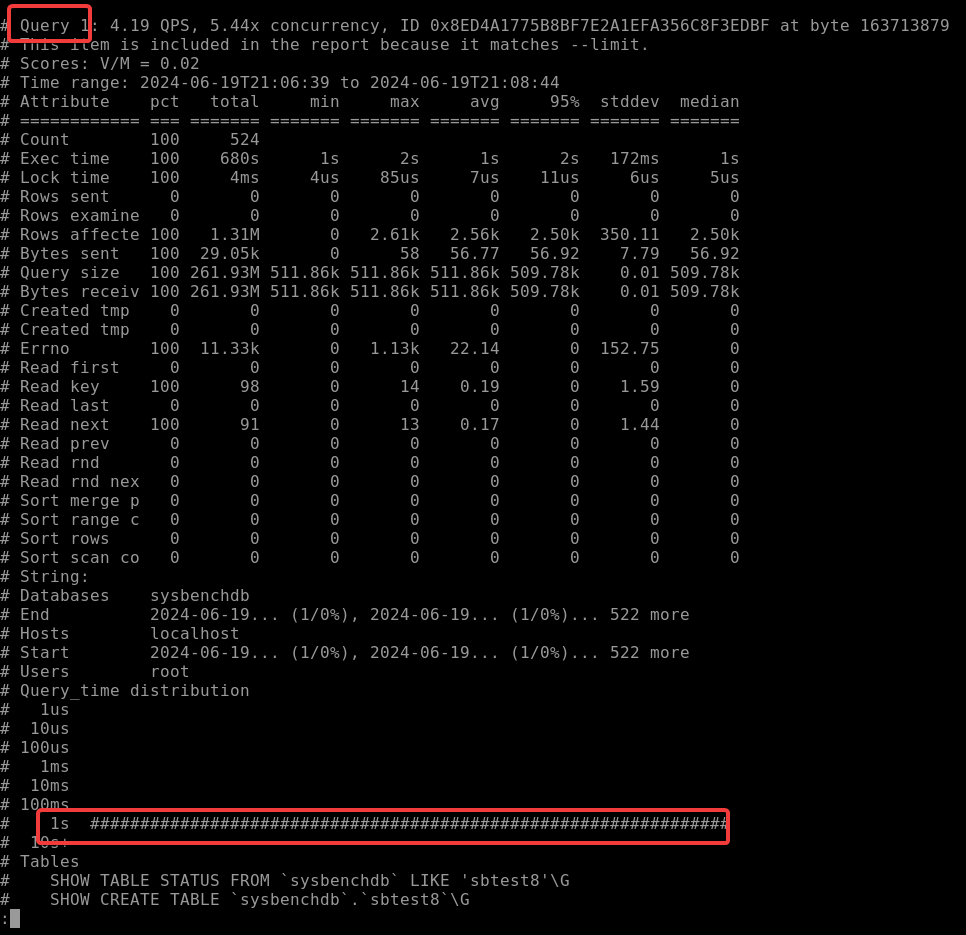
Below will show the query itself who execute it , when it was executed , by which user it executed
