One of the key tasks for any PostgreSQL DBA is conducting daily health checks to ensure the database remains healthy. Performing these checks is critical as it helps identify potential issues and resolve them before they impact production. PostgreSQL provides several views to monitor various metrics such as wait states, CPU usage, I/O, and more.
However, today we’ll focus on a tool called pgmetrics.
pgmetrics is an open-source, zero-dependency, single-binary tool that can collect over 350 metrics from a running PostgreSQL server. It presents the data in an easy-to-read text format or allows you to export it as JSON or CSV for further analysis. This tool will help us monitor various aspects, including replication, slow queries, buffer usage, WAL status, and CPU & RAM usage.
Installing pgmetrics
Installing pgmetrics is quite simple and involves just downloading the binary.
- download binary
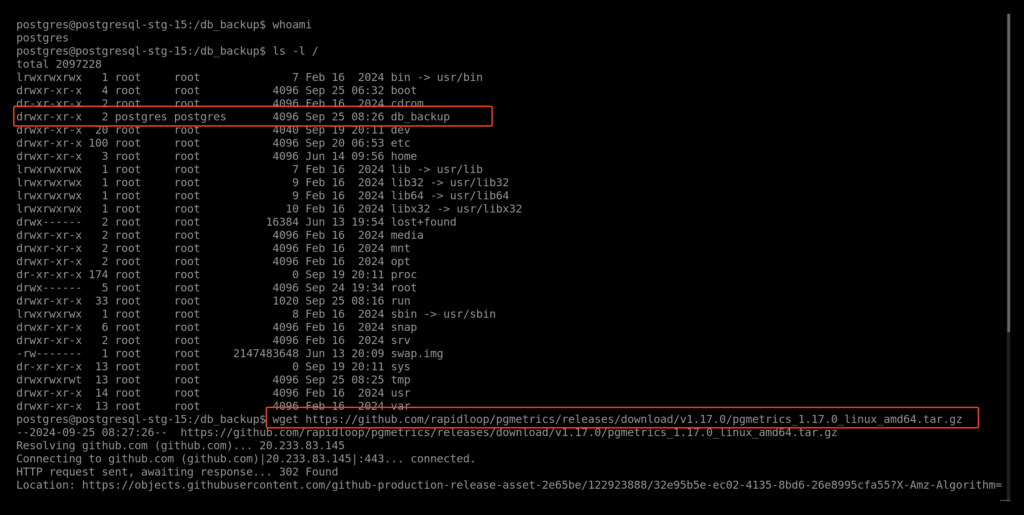
Make sure to download the binary using thepostgresuser and save it in a directory owned by PostgreSQL. For my lab setup, I’ve already created a directory for backups, which I will use to download pgmetrics.
sudo su - postgres


wget https://github.com/rapidloop/pgmetrics/releases/download/v1.17.0/pgmetrics_1.17.0_linux_amd64.tar.gz
- extract the binary.
tar xvf pgmetrics_1.17.0_linux_amd64.tar.gz

- change directory to extracted binary and start check various option option using
--help
cd pgmetrics_1.17.0_linux_amd64/
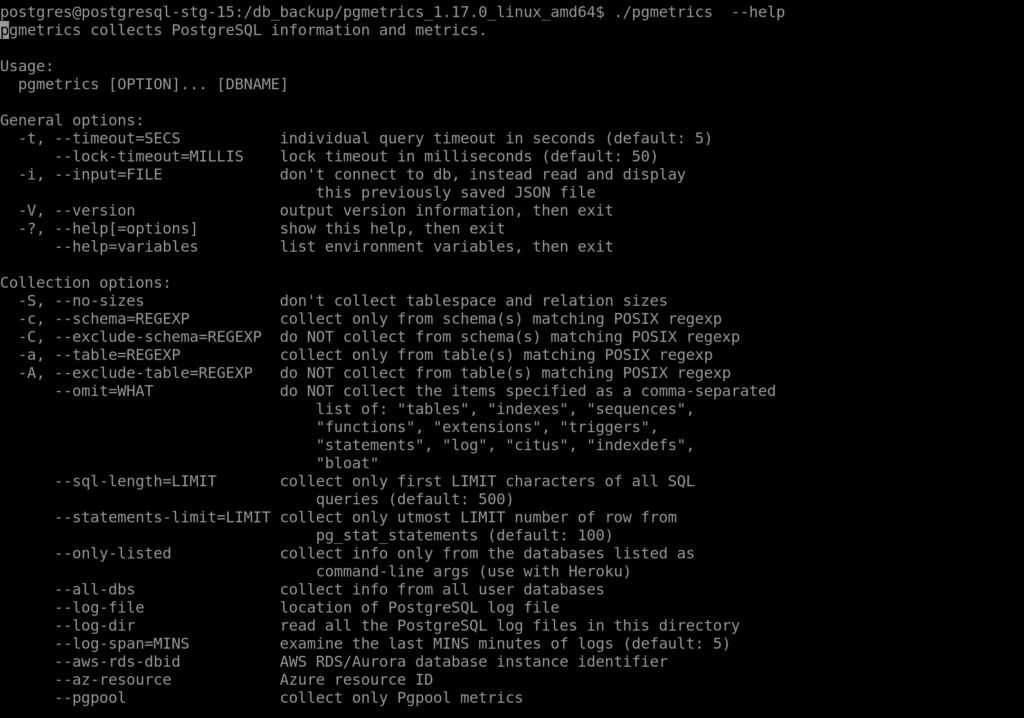
./pgmetrics --help
Using pgmetrics
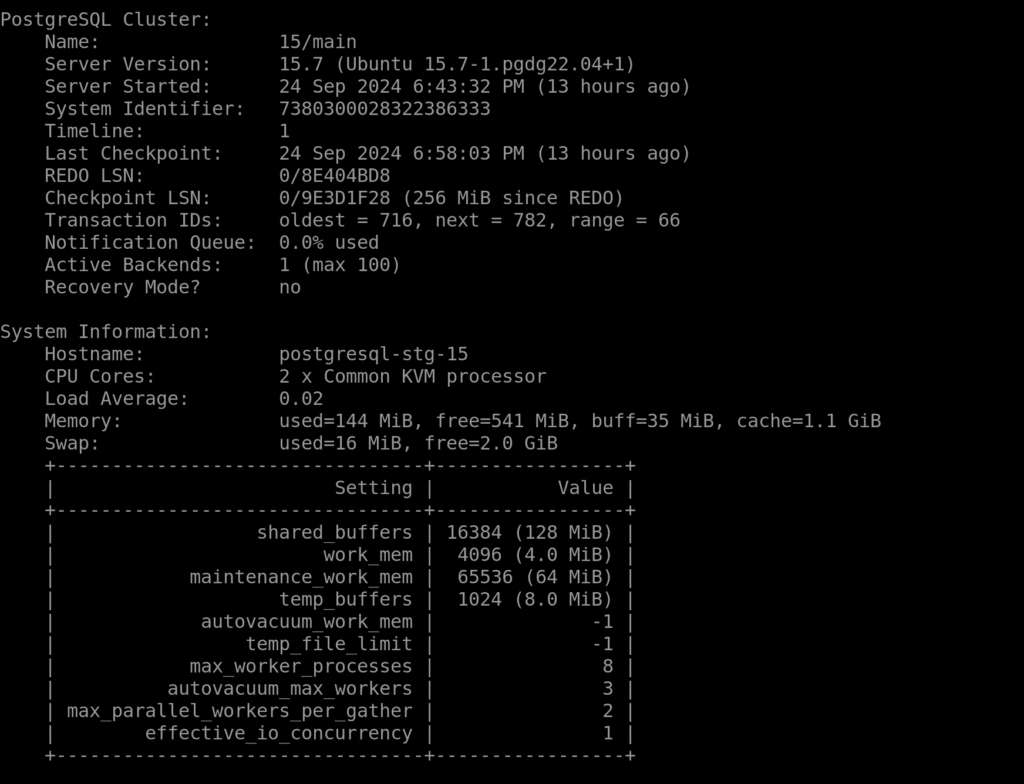
to view the report i will use --all-dbs which will show status of all database
./pgmetrics --all-dbs
here are the metric you will get when executing the command
- Server: version, system identifier, timeline, transaction id wraparound, checkpoint lag
- Replication: primary-side, standby-side, physical and logical replication slots
- WAL Archiving: archive rate, wal and ready file counts, last success and fail time
- BG Writer: checkpoint rate, total checkpoints (sched+req), buffers
- Checkpointer: checkpoints and restartpoints performed, buffers written, time taken
- Vacuum-related: ongoing auto/manual vacuum progress, last analyze/vacuum, settings
- Tablespaces: location, size, disk and inode usage of filesystem
- Database: size, bloat, disabled triggers, installed extensions, temp files, transaction id wraparound, deadlocks, conflicts
- Roles: users, groups, membership
- Active backends: transaction running too long, idling in transaction, waiting for locks
- Tables: vacuum, analyze, row estimates, idx and seq scans, cache hit ratio, HOT update ratio, size, bloat
- Indexes: cache hit ratio, scans, rows read/scan, rows fetched/scan
- Sequences: cache hit ratio
- System metrics: cores, load average, memory and disk usage
- Settings: current values, and default ones where different
- Slow queries: from pg_stat_statements, if available
- Locks: granted and waiting locks, from pg_locks
- Job Progress: progress of analyze, backup, cluster, copy, create index and vacuum jobs
- Blocked queries: blocked queries, along with the queries that they are waiting for
pg_stat_statements
pg_stat_statements is an extension for PostgreSQL that tracks and records statistics about SQL queries executed in the database. It provides a way to monitor query performance, helping DBAs identify slow or expensive queries, optimize resource usage, and improve overall performance.
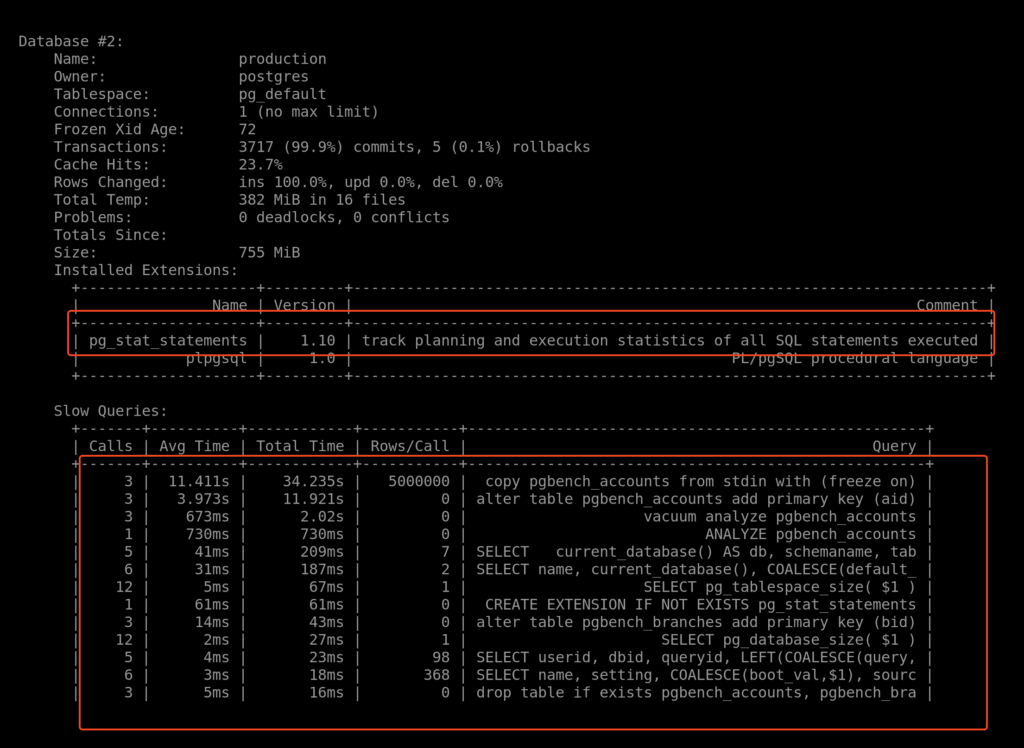
when using pgmetrics it advisable to enable pg_stat_statements extension to get report of slow query which is very useful when performing health check or even try to identify slow running query
Enable pg_stat_statements
pg_stat_statements should be already installed with postgresql but only change that you have to update the parameter shared_preload_libraries and include .
sudo nano /etc/postgresql/15/mainpostgresql.conf
shared_preload_libraries = 'pg_stat_statements'

After that restart postgresql services
sudo systemctl restart postgresql@15-main.service
now login to psql change to database you want to enable the extension
sudo -u postgres psql
\c production

CREATE EXTENSION pg_stat_statements;
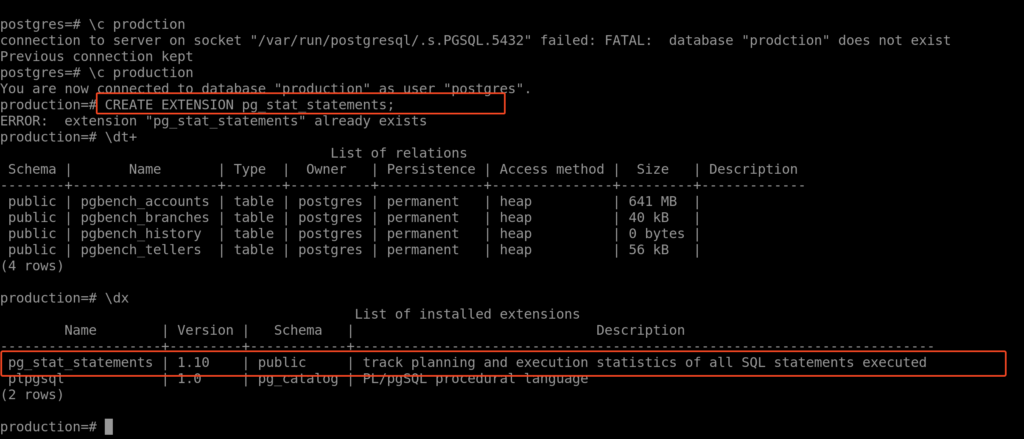
Now, run the command ./pgmetrics --all-dbs and scroll down until you reach the database where you enabled the extension. You should see the top most expensive queries listed there.
